
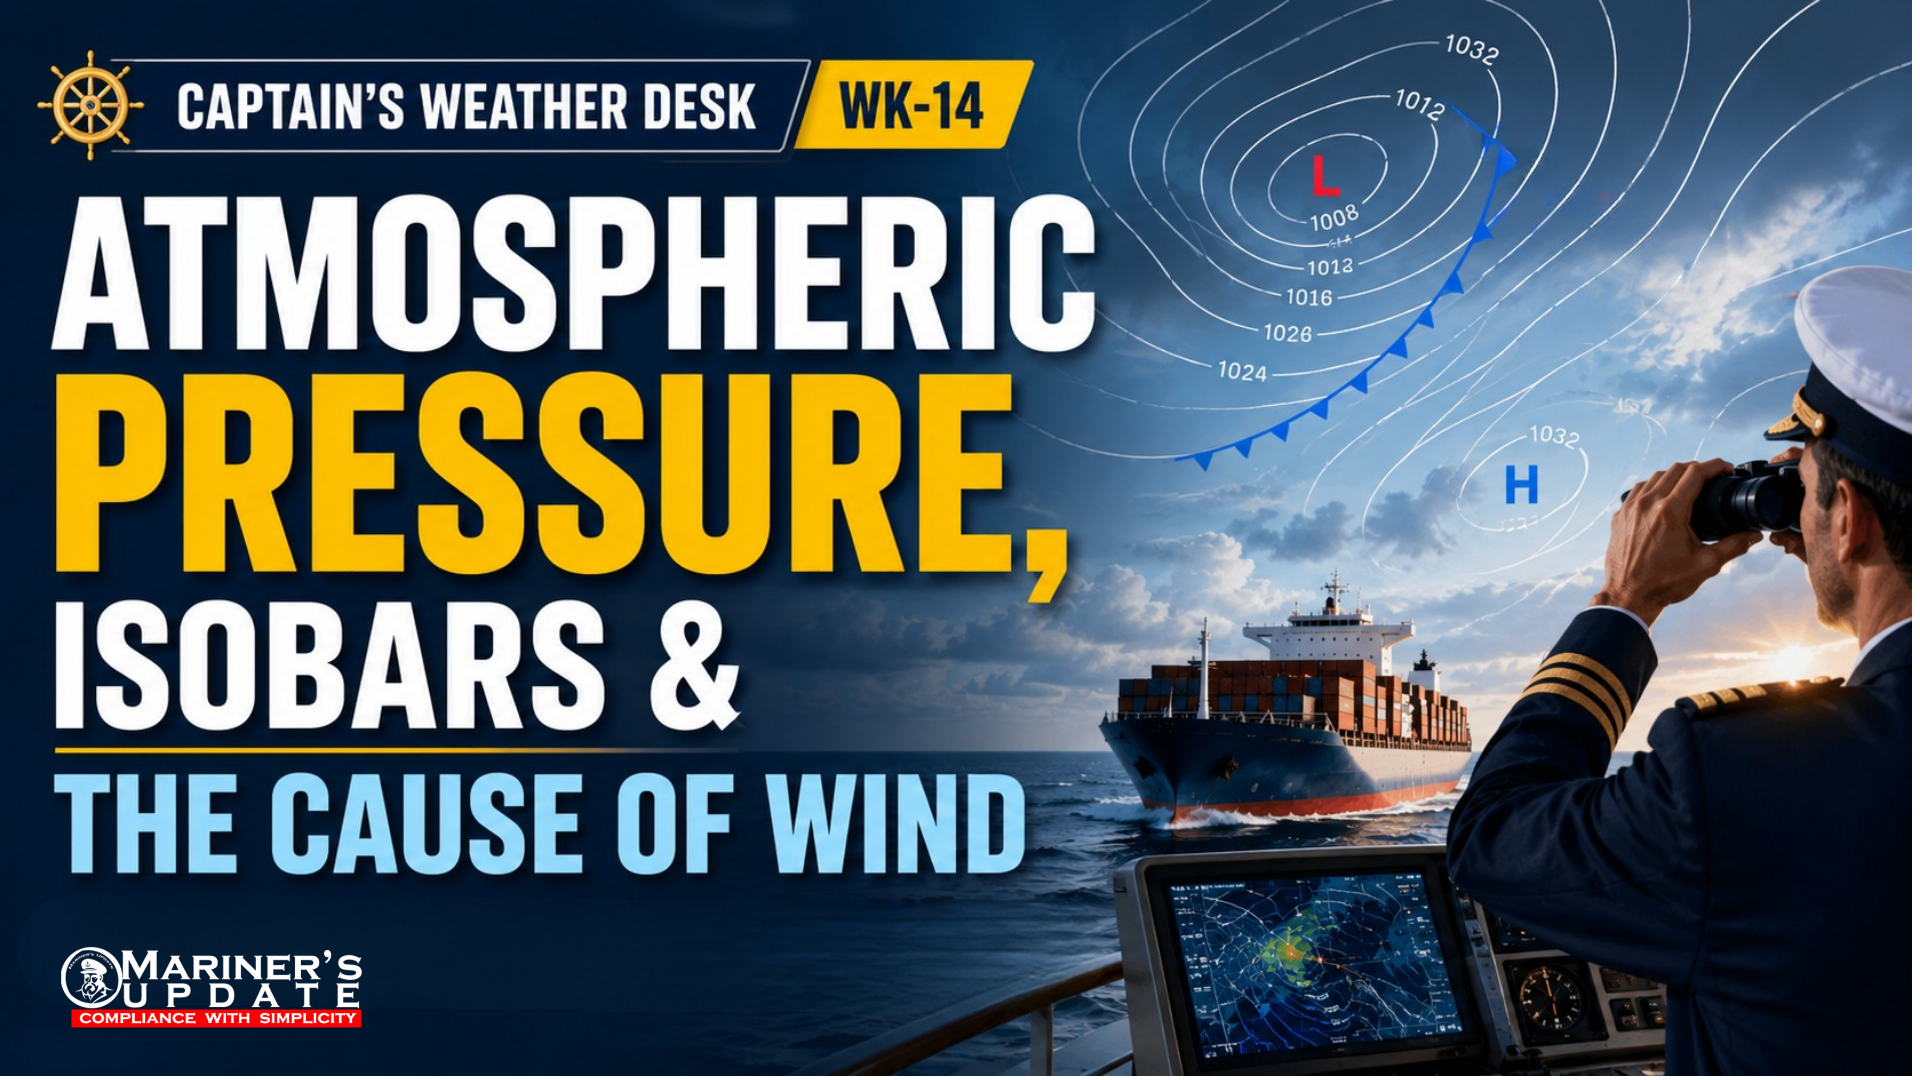
Understanding atmospheric pressure is one of the fundamental skills required for interpreting weather charts and anticipating changes in weather at sea. Pressure patterns provide valuable clues about wind strength, weather systems and developing conditions.
1. ATMOSPHERIC PRESSURE
Atmospheric pressure is the force exerted by the weight of the air above a particular point on the Earth’s surface.
Although air cannot normally be seen, it has weight. The entire column of air extending from the Earth’s surface upward through the atmosphere produces pressure on the surface below.
Atmospheric pressure acts in all directions, unlike gravity, which acts vertically downward.
Pressure and Height
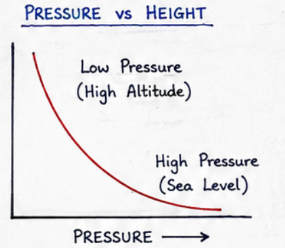
Atmospheric pressure is not constant with height.
As altitude increases, the amount of air above a particular point becomes smaller. Therefore, atmospheric pressure decreases with increasing height.
For example:
- At sea level, the average atmospheric pressure is approximately 1012 hPa.
- At around 5,500 m (18,000 ft), atmospheric pressure is approximately half of the sea-level value.
This relationship is important in aviation, meteorology and marine weather analysis because pressure observations must be interpreted in relation to height and atmospheric conditions.
2. UNITS OF BAROMETRIC PRESSURE
Atmospheric pressure has traditionally been measured using the height of a mercury column in a barometer.
Common units include:
Millimetres of mercury (mmHg) Inches of mercury (inHg)
In modern meteorology, including marine weather information, pressure is normally expressed in:
hPa – hectopascals
The unit millibar (mb) is numerically equivalent to the hectopascal:
1 hPa = 1 mb
A standard reference pressure is approximately:
1012 hPa ≈ 760 mmHg ≈ 29.92 inHg
On marine weather charts, pressure values are generally given in hPa, making it easier to compare pressure observations between different locations.
3. ISOBARS
An isobar is a line drawn on a weather chart connecting points that have the same atmospheric pressure, usually after reducing the observations to a common reference level.
Isobars are normally drawn at regular pressure intervals, such as 1, 2, 4 or 5 hPa, depending on the chart and its purpose.
By looking at the arrangement of isobars, a navigator can quickly identify important pressure systems and estimate the distribution of pressure over a large area.
What Can Isobars Tell Us?
Isobar patterns help identify features such as:
- Depressions / Low-pressure systems
- Anticyclones / High-pressure systems
- Ridges
- Troughs
- Areas where pressure is changing significantly
The shape and spacing of the isobars provide important information about the expected weather and wind conditions.
Closely Spaced Isobars = Stronger Wind
One of the most useful rules for interpreting a weather chart is:
The closer the isobars are together, the stronger the pressure gradient and generally the stronger the wind.
Widely spaced isobars usually indicate a weaker pressure gradient and lighter winds, although local effects and other atmospheric factors must also be considered.
4. CAUSE OF WIND
Wind is essentially air in horizontal motion.
The primary force responsible for initiating this horizontal movement is the Pressure Gradient Force (PGF).
Atmospheric pressure is rarely exactly the same everywhere. When there is a difference in pressure between two locations, air experiences a force that tends to move it:
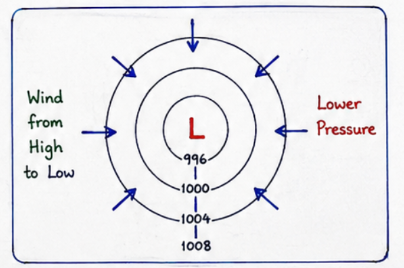
From HIGH pressure → towards LOW pressure
The greater the difference in pressure over a given distance, the stronger the pressure gradient and the greater the force available to accelerate the air.
Therefore:
Large pressure difference + short distance = strong pressure gradient = stronger wind
This is why areas with tightly packed isobars on a weather chart are often associated with stronger winds.
WHY THIS MATTERS TO THE MASTER
Atmospheric pressure is more than just a number displayed on a barometer or weather chart.
A falling or rising pressure trend, together with the distribution and movement of pressure systems, can provide an early indication of changing weather conditions.
By combining:
Pressure observations + pressure trends + isobar patterns + forecast information
the Master can develop a better understanding of the expected wind and weather situation along the vessel’s route.
KEY TAKEAWAYS
✔ Atmospheric pressure is the weight/force of the air above a given point.
✔ Pressure decreases as altitude increases.
✔ Isobars connect points of equal atmospheric pressure on a weather chart.
✔ Closely spaced isobars indicate a stronger pressure gradient and generally stronger winds.
✔ The Pressure Gradient Force drives air from areas of higher pressure towards areas of lower pressure.
✔ Understanding pressure patterns helps the bridge team anticipate changes in wind and weather and supports safer passage planning.